Figure 10-19 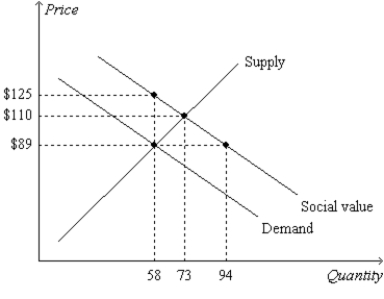
-Refer to Figure 10-19. Note that the lines labeled "Demand" and "Social Value"are parallel. Also, the slopes of the lines on the graph reflect the following facts: (1) Private value and social value decrease by $1.00 with each additional unit of the good that is consumed, and (2) private cost increases by $1.40 with each additional unit of the good that is produced. Thus, when the 74th unit of the good is produced and consumed, social well-being
A) decreases by $2.40.
B) decreases by $1.60.
C) increases by $1.00.
D) increases by $1.40.
Correct Answer:
Verified
Q217: Figure 10-16 Q218: Table 10-5 Q219: Two firms, A and B, each currently Q220: Table 10-6 Q221: Which of the following statements is correct Q223: Figure 10-18. The graph represents a corrective Q224: Figure 10-19 Q225: Which of the following policies is an Q226: Figure 10-19 Q227: The business activities of Firm A confer Unlock this Answer For Free Now! View this answer and more for free by performing one of the following actions Scan the QR code to install the App and get 2 free unlocks Unlock quizzes for free by uploading documents![]()
The following table shows the marginal
The following table shows the total![]()
![]()

