Figure 10-16 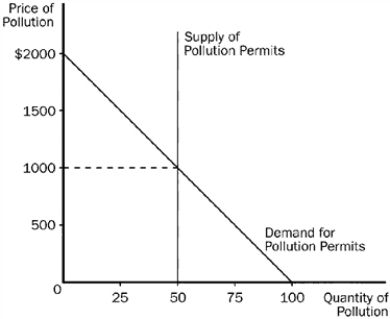
-Refer to Figure 10-16. This graph shows the market for pollution when permits are issued to firms and traded in the marketplace. In the absence of a pollution permit system, the quantity of pollution would be
A) 25
B) 50
C) 75
D) 100
Correct Answer:
Verified
Q212: Figure 10-17 Q213: Table 10-5 Q214: Two firms, A and B, each currently Q215: Two firms, A and B, each currently Q216: Figure 10-16 Q218: Table 10-5 Q219: Two firms, A and B, each currently Q220: Table 10-6 Q221: Which of the following statements is correct Q222: Figure 10-19 Unlock this Answer For Free Now! View this answer and more for free by performing one of the following actions Scan the QR code to install the App and get 2 free unlocks Unlock quizzes for free by uploading documents![]()
The following table shows the marginal![]()
The following table shows the marginal
The following table shows the total![]()

