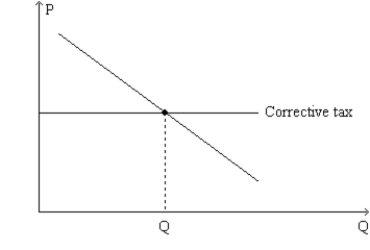
Figure 10-18. The graph represents a corrective tax to reduce pollution. On the axes, Q denotes the quantity of pollution and P represents the price of pollution. 
-Refer to Figure 10-18. The line labeled "Corrective tax" could accurately be re-labeled as
A) "Demand for clean air."
B) "Demand for pollution rights."
C) "Price of pollution."
D) "Rate of subsidy."
Correct Answer:
Verified
Q218: Table 10-5
The following table shows the marginal
Q219: Two firms, A and B, each currently
Q220: Table 10-6
The following table shows the total
Q221: Which of the following statements is correct
Q222: Figure 10-19 Q224: Figure 10-19 Q225: Which of the following policies is an Q226: Figure 10-19 Q227: The business activities of Firm A confer Q228: Figure 10-19 Unlock this Answer For Free Now! View this answer and more for free by performing one of the following actions Scan the QR code to install the App and get 2 free unlocks Unlock quizzes for free by uploading documents![]()
![]()
![]()
![]()

