Use the REGRESSION feature on a graphing calculator.
-A study was conducted to compare the average time spent in the lab each week versus course grade for computer students.The results are recorded in the table below. 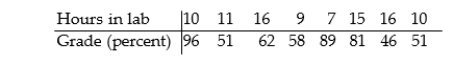 Use linear regression to find a linear function that predicts a student's course grade as a function of the number of hours spent in lab.
A) y = 1.86 + 88.6x
B) y = 0.930 + 44.3x
C) y = 44.3 + 0.930x
D) y = 88.6 - 1.86x
Correct Answer:
Verified
Q36: Write an equation of the line with
Q41: Use the REGRESSION feature on a graphing
Q42: Use the graph to find the average
Q44: Provide an appropriate response.
-Given two points (x1,y1)and
Q45: Use the REGRESSION feature on a graphing
Q46: Use the REGRESSION feature on a graphing
Q47: Use the REGRESSION feature on a graphing
Q48: Use the graph to find the average
Q49: Use the REGRESSION feature on a graphing
Q69: Solve the problem.
-Suppose the sales of a
Unlock this Answer For Free Now!
View this answer and more for free by performing one of the following actions

Scan the QR code to install the App and get 2 free unlocks

Unlock quizzes for free by uploading documents