Use the REGRESSION feature on a graphing calculator.
-The use of bottled water in the United States has shown a steady increase in recent years.The table shows the annual per capita consumption for the years 1995 - 2001. 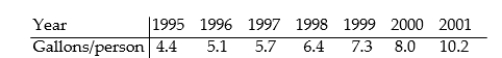 With x being the years since 1995,find the linear function that represents this data.Round your answer to two decimal places.
A) y = 0.04x3 - 0.23x2 + 1.01x + 4.35
B) y = 0.89x + 4.07
C) y = 0.1x2 + 0.29x + 4.57
D) y = 4.07x + 0.89
Correct Answer:
Verified
Q36: Write an equation of the line with
Q41: Use the REGRESSION feature on a graphing
Q42: Use the graph to find the average
Q44: Provide an appropriate response.
-Given two points (x1,y1)and
Q45: Use the REGRESSION feature on a graphing
Q47: Use the REGRESSION feature on a graphing
Q48: Use the graph to find the average
Q49: Use the REGRESSION feature on a graphing
Q50: Use the REGRESSION feature on a graphing
Q69: Solve the problem.
-Suppose the sales of a
Unlock this Answer For Free Now!
View this answer and more for free by performing one of the following actions

Scan the QR code to install the App and get 2 free unlocks

Unlock quizzes for free by uploading documents