Use the following to answer questions
This figure depicts the typical relation found between a person's age (in years) and his or her reaction time in a simple reaction time task (e.g., time to press a button when a light turns green) .
Figure: Age and Reaction Time 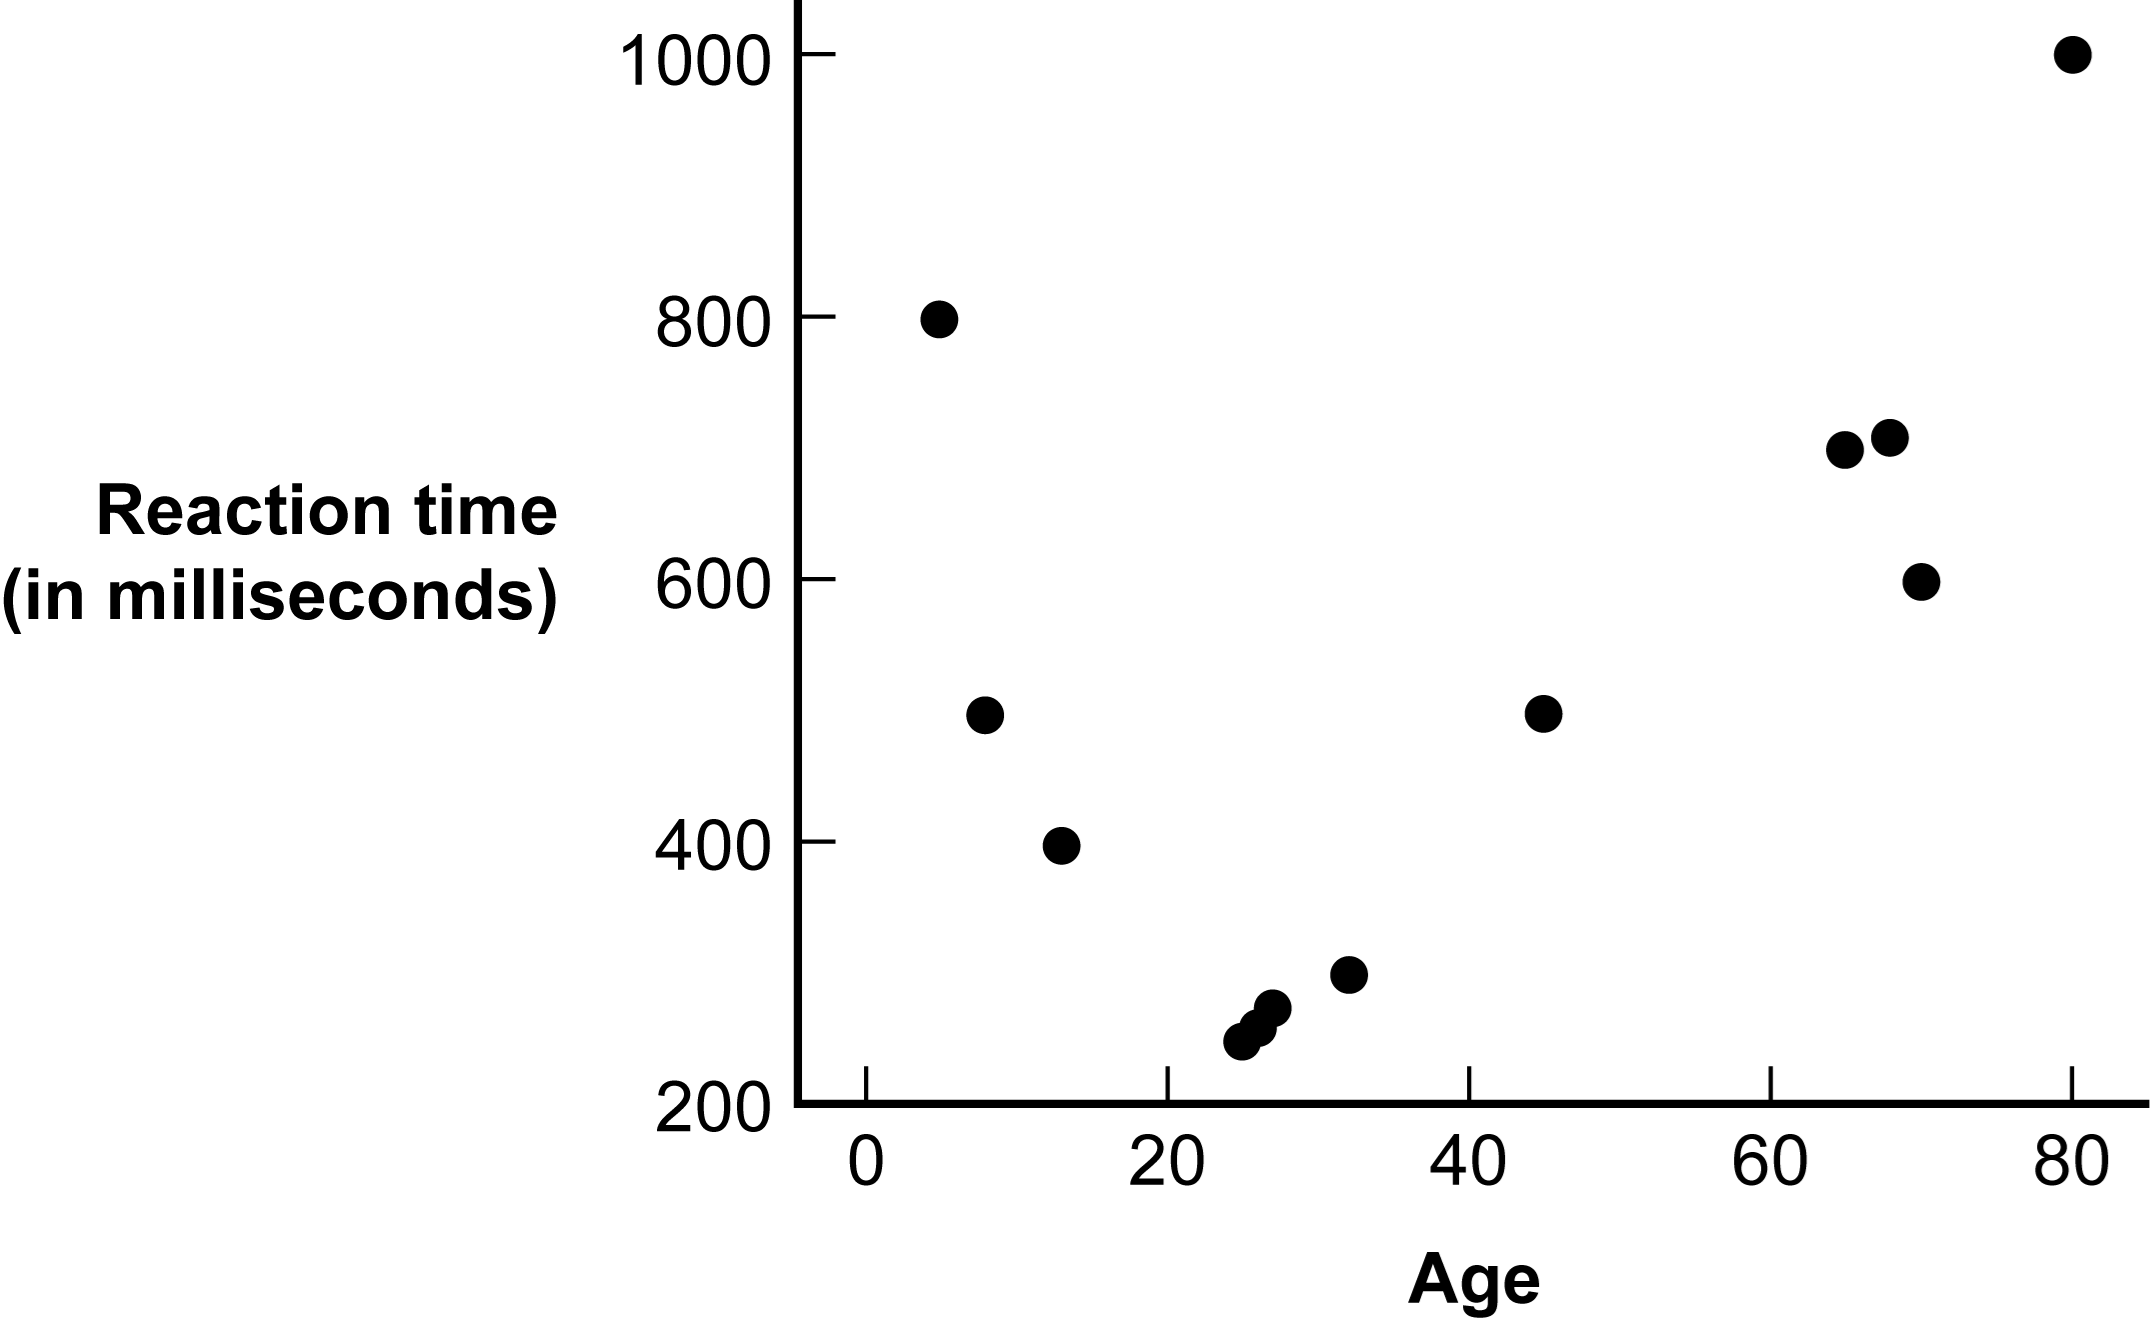
-(Figure: Age and Reaction Time) Which statement best captures what the graph depicts?
A) Reaction time decreases throughout childhood and adolescence, becoming fastest in a person's early 20s, but after that point, reaction time slowly increases as a person continues to age.
B) There is a linear relation between age and reaction time such that reaction time increases with increased age.
C) Reaction time increases throughout childhood and adolescence, becoming slowest in a person's early 20s, but after that point, reaction time slowly decreases as a person continues to age.
D) There is no relation between age and reaction time.
Correct Answer:
Verified
Q4: Use the following to answer questions
Figure:
Q5: To efficiently conduct an alumni survey, a
Q6: Use the following to answer questions
This
Q7: A researcher labels the dependent variable of
Q8: Use the following to answer questions
Figure:
Q10: The interpolation lie can involve:
A) using a
Q11: Use the following to answer questions
This
Q12: In the _ lie participants in a
Q13: Use the following to answer questions
This
Q14: Use the following to answer questions
This
Unlock this Answer For Free Now!
View this answer and more for free by performing one of the following actions

Scan the QR code to install the App and get 2 free unlocks

Unlock quizzes for free by uploading documents