Use the following to answer questions
This figure depicts the results of a study by Ahluwalia et al.(2006) investigating the effects of two types of gum (placebo or nicotine) and two types of counseling (educational or motivational) in helping people to stop smoking.
Figure: Smoking Cessation 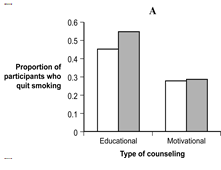
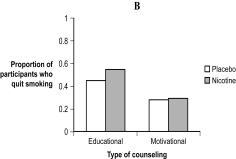
-(Figure: Smoking Cessation) What is the difference between the data depicted in Figure A and the data in Figure B?
A) Figure A does not graph the same independent variables as Figure B.
B) Figure A does not graph the same dependent variable as Figure B.
C) The bars in Figure A are more accurate than those in Figure B.
D) The y-axis in Figure A has been shortened, which exaggerates the differences between the groups.
Correct Answer:
Verified
Q8: Use the following to answer questions
Figure:
Q9: Use the following to answer questions
This
Q10: The interpolation lie can involve:
A) using a
Q11: Use the following to answer questions
This
Q12: In the _ lie participants in a
Q14: Use the following to answer questions
This
Q15: Use the following to answer questions
This
Q16: Use the following to answer questions
Figure:
Q17: Use the following to answer questions
Figure:
Q18: What type of lie is it when
Unlock this Answer For Free Now!
View this answer and more for free by performing one of the following actions

Scan the QR code to install the App and get 2 free unlocks

Unlock quizzes for free by uploading documents