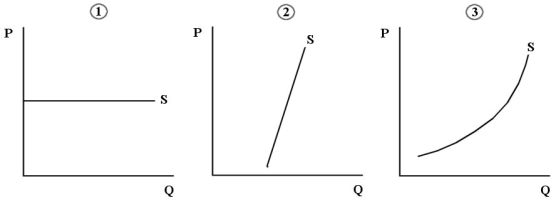
FIGURE 13- 4 The three diagrams below each show a supply curve for oil tankers over a relatively short period of time.
-John Smith plays baseball for $500 000 per year,but if he were not a baseball player,his next best alternative would be to earn $35 000 per year as a sales representative.By playing baseball,Smith is earning economic rent of
A) zero.
B) $465 000.
C) $535 000.
D) $35 000.
E) $500 000.
Correct Answer:
Verified
Q7: FIGURE 13- 1 Q8: FIGURE 13- 4 The three diagrams below Q9: FIGURE 13- 3 The demand and supply Q10: Consider labour that is hired for $18 Q11: Consider the following production and cost Q13: Consider the following table for a Q14: Profit- maximizing firms increase production up to Q15: Consider the following production and cost Q16: The diagram below shows the MRP curve Q17: Which of the following is the best![]()
Unlock this Answer For Free Now!
View this answer and more for free by performing one of the following actions

Scan the QR code to install the App and get 2 free unlocks

Unlock quizzes for free by uploading documents