FIGURE 13- 4 The three diagrams below each show a supply curve for oil tankers over a relatively short period of time.
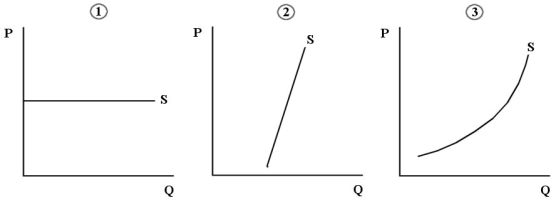
-Refer to Figure 13- 4.Consider the supply of oil tankers to an individual Canadian shipping firm,the North American shipping industry,and the world shipping industry.Which diagram best shows the supply of oil tankers that is relevant to the North American shipping industry?
A) diagram 1
B) diagram 2
C) diagram 3
D) diagrams 2 or 3
E) diagrams 1 or 2
Correct Answer:
Verified
Q3: FIGURE 13- 1 Q4: FIGURE 13- 4 The three diagrams below Q5: Consider a small firm that is producing Q6: Suppose all Canadians earned equal incomes.In this![]()
Unlock this Answer For Free Now!
View this answer and more for free by performing one of the following actions

Scan the QR code to install the App and get 2 free unlocks

Unlock quizzes for free by uploading documents