FIGURE 13- 1 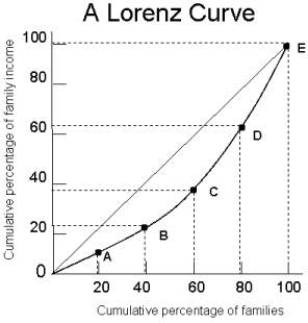
-Refer to Figure 13- 1.On the Lorenz curve shown in the diagram,
A) perfect equality of income distribution occurs.
B) the functional distribution of income is shown.
C) the richest 20% of families earn over 60% of total income.
D) the richest 20% of families earn almost 40% of total income.
E) the poorest 20% of families earn almost 90% of total income.
Correct Answer:
Verified
Q2: According to the hypothesis of "equal net
Q3: FIGURE 13- 1 Q4: FIGURE 13- 4 The three diagrams below Q5: Consider a small firm that is producing Q6: Suppose all Canadians earned equal incomes.In this Q8: FIGURE 13- 4 The three diagrams below Q9: FIGURE 13- 3 The demand and supply Q10: Consider labour that is hired for $18 Q11: Consider the following production and cost Q12: FIGURE 13- 4 The three diagrams below![]()
Unlock this Answer For Free Now!
View this answer and more for free by performing one of the following actions

Scan the QR code to install the App and get 2 free unlocks

Unlock quizzes for free by uploading documents