Table 5.2 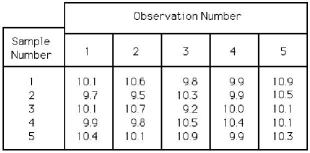
-Using Table 5.2,for the  chart,what is the value of the lower control limit for the x-bar chart?
A) less than or equal to 9.00
B) greater than 9.00 but less than or equal to 9.99
C) greater than 9.99 but less than or equal to 10.99
D) greater than 10.99
Correct Answer:
Verified
Q113: Historically,the average time to service a customer
Q114: A company is interested in monitoring the
Q115: The central line on a p-chart is
Q116: Table 5.1
Factors for Calculating Three-Sigma Limits for
Q117: A company is interested in monitoring the
Q119: Table 5.2 Q120: Table 5.2 Q124: If an x-bar chart is constructed using Q126: Table 5.3 Q131: Table 5.4 Unlock this Answer For Free Now! View this answer and more for free by performing one of the following actions Scan the QR code to install the App and get 2 free unlocks Unlock quizzes for free by uploading documents![]()
![]()
![]()
The manager of Champion Cooling Company

