Multiple Choice
Table 5.2 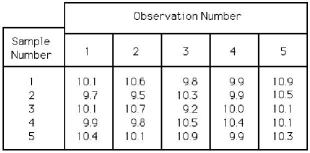
-Using Table 5.2,for the  chart,what is the value of the upper control limit for the x-bar chart?
A) less than or equal to 9.00
B) greater than 9.00 but less than or equal to 9.99
C) greater than 9.99 but less than or equal to 10.99
D) greater than 10.99
Correct Answer:
Verified
Related Questions
Q114: A company is interested in monitoring the
Q115: The central line on a p-chart is
Q116: Table 5.1
Factors for Calculating Three-Sigma Limits for
Q117: A company is interested in monitoring the

