The following table shows the probability of demand for automobiles used in an Excel simulation. 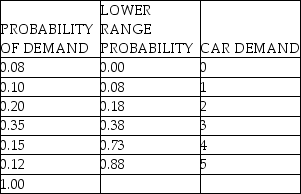 The "= RAND() " function results in a random number for week #1 of 0.2239.The "= VLOOKUP" function is used with the table above to generate a random car demand for week #1.The resulting random car demand for this week is:
A) 1 car.
B) 2 cars.
C) 3 cars.
D) 4 cars.
Correct Answer:
Verified
Q16: _ is the act of reproducing the
Q21: How can random numbers be generated?
Q28: A simulation model is used to test
Q32: _ uses random numbers to generate simulation
Q43: When the data needed to set up
Q45: What is steady state in a simulation
Q49: Scenario E.1
SimQuick is being used to simulate
Q50: The arrival of customers at a lemonade
Q51: Which of the following statements about SimQuick
Q54: Scenario E.1
SimQuick is being used to simulate
Unlock this Answer For Free Now!
View this answer and more for free by performing one of the following actions

Scan the QR code to install the App and get 2 free unlocks

Unlock quizzes for free by uploading documents