In the graph of Galton's height data below, which line on the graph represents the mean height of the offspring for a given average height of the mother and father? 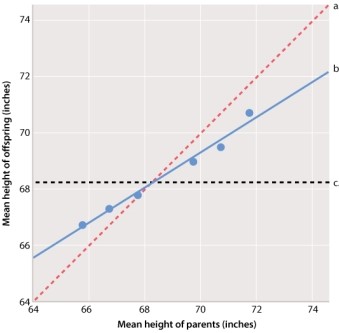
A) line a
B) line b
C) line c
Correct Answer:
Verified
Q56: Red coloration in wheat seeds is a
Q57: In regard to gaining weight, some human
Q58: Genetic differences are always more important than
Q59: Which of the traits depicted here has
Q60: Similar to single gene traits, traits determined
Q62: After reviewing the graph below, one could
Q63: The scatterplots below show the relation between
Q64: In the graph of Galton's height data
Q65: Which line on the graph below demonstrates
Q66: Heritability is a measure of the:
A)extent to
Unlock this Answer For Free Now!
View this answer and more for free by performing one of the following actions

Scan the QR code to install the App and get 2 free unlocks

Unlock quizzes for free by uploading documents