In the graph of Galton's height data below, which line on the graph represents the population mean? 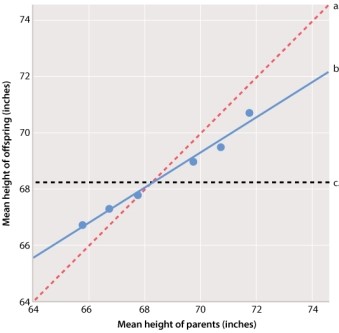
A) line a
B) line b
C) line c
Correct Answer:
Verified
Q59: Which of the traits depicted here has
Q60: Similar to single gene traits, traits determined
Q61: In the graph of Galton's height data
Q62: After reviewing the graph below, one could
Q63: The scatterplots below show the relation between
Q65: Which line on the graph below demonstrates
Q66: Heritability is a measure of the:
A)extent to
Q67: Heritability is the proportion of the total
Q68: Nilsson-Ehle's studies of seed color in wheat
Q69: Which of the traits in the
Unlock this Answer For Free Now!
View this answer and more for free by performing one of the following actions

Scan the QR code to install the App and get 2 free unlocks

Unlock quizzes for free by uploading documents