Refer to the following figure when answering the following questions.
Figure 9.2: U.S. Output Fluctuations 1960-2015 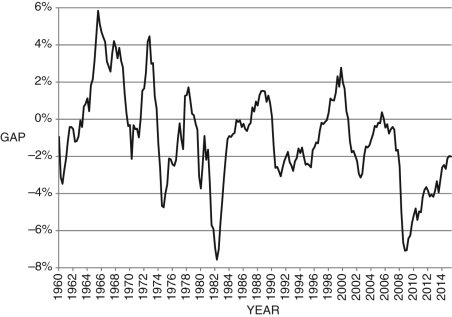
-Consider Figure 9.2. In approximately what years did the U.S. economy experience its longest economic downturn, using the text's definition of a recessionary gap?
A) 1990-1997
B) 1974-1978
C) 1980-1988
D) 1957-1963
E) 2008-2016
Correct Answer:
Verified
Q35: If current output is Q36: Refer to the following figure when answering Q37: According to the text, which of the Q38: Since 1970, for the U.S. economy, the Q39: Refer to the following figure when answering Q41: The Phillips curve in the text shows Q42: Generally speaking, the rate of inflation _ Q43: According to the Phillips curve presented in Q44: In 1979, the inflation rate reached about Q45: Refer to the following figure when answering![]()
Unlock this Answer For Free Now!
View this answer and more for free by performing one of the following actions

Scan the QR code to install the App and get 2 free unlocks

Unlock quizzes for free by uploading documents