Refer to the following figure when answering the following questions.
Figure 9.2: U.S. Output Fluctuations 1960-2015 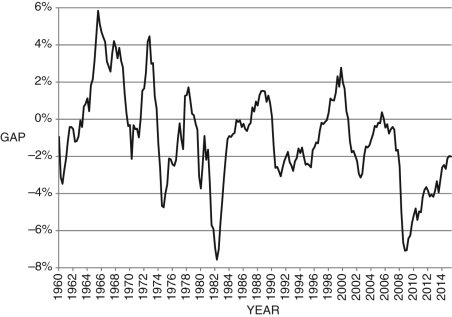
-Consider Figure 9.2. In approximately which of the following years was current output equal to potential output?
A) 1966, 1974, 1979, 2000, and 2004
B) 1961, 1975, 1983, 2002, and 2009
C) 1963, 1970, 1974, 1985, 1998, 2001, and 2005
D) 1961, 1975, 1979, 2000, and 2008
E) 1966, 1974, 1983, 2002, and 2010
Correct Answer:
Verified
Q34: Defining Q35: If current output is Q36: Refer to the following figure when answering Q37: According to the text, which of the Q38: Since 1970, for the U.S. economy, the Q40: Refer to the following figure when answering Q41: The Phillips curve in the text shows Q42: Generally speaking, the rate of inflation _ Q43: According to the Phillips curve presented in Q44: In 1979, the inflation rate reached about![]()
![]()
Unlock this Answer For Free Now!
View this answer and more for free by performing one of the following actions

Scan the QR code to install the App and get 2 free unlocks

Unlock quizzes for free by uploading documents