Below are shown a dot plot and summary statistics for a random sample of 34 shower heads.The measurements are maximum flow rates (in gallons per minute)at pressure of 80 pounds per square inch.Use the data to illustrate the difference between the two alternative definitions of "outlier," and make any other comments you feel are relevant.Note: Trim Mean removes the smallest 5 percent and the largest 5 percent of the values. 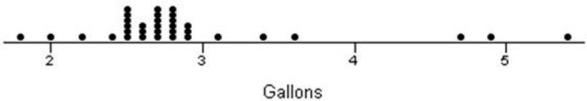

Correct Answer:
Verified
View Answer
Unlock this answer now
Get Access to more Verified Answers free of charge
Q122: A 10-point quiz was given by Professor
Q126: Bob's sample of freshman GPAs showed a
Q130: A national survey showed that most commuter
Q146: Six graduates from Fulsome University's Master's of
Q146: Craig operates a part-time snow-plowing business using
Q147: Here are descriptive statistics from Excel for
Q149: The owner of a chicken farm kept
Q150: Here are advertised prices of 21 used
Q152: Craig operates a part-time snow-plowing business using
Q154: The athletic departments at 10 randomly selected
Unlock this Answer For Free Now!
View this answer and more for free by performing one of the following actions

Scan the QR code to install the App and get 2 free unlocks

Unlock quizzes for free by uploading documents