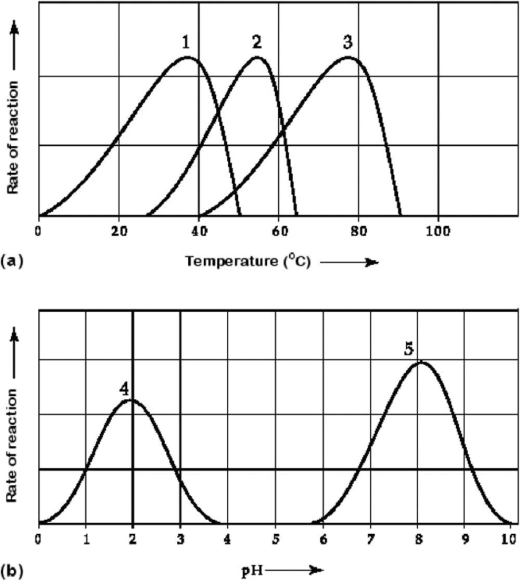
 Figure 6.3 Activity of various enzymes (a) at various temperatures and (b) at various pH.
-Which temperature and pH profile curves on the graphs in Figure 6.3 were most likely generated from analysis of an enzyme from a human stomach, where conditions are strongly acid?
A) curves 1 and 4
B) curves 1 and 5
C) curves 2 and 4
D) curves 2 and 5
E) curves 3 and 4
Correct Answer:
Verified
Q30: Which of the following is true of
Q45: In addition to regulating enzymes with activators
Q46: A severe fever can result in death
Q46: Cooperativity is a form of allosteric activation
Q47: Under a particular set of conditions in
Q48: Increasing the enzyme concentration in an enzymatic
Q49: An aminoacyl-tRNA synthetase is the enzyme that
Q53: Which of the following is an example
Q54: In experimental tests of enzyme evolution, a
Q60: Some of the drugs used to treat
Unlock this Answer For Free Now!
View this answer and more for free by performing one of the following actions

Scan the QR code to install the App and get 2 free unlocks

Unlock quizzes for free by uploading documents