A phase portrait of a predator-prey system is given below in which F represents the population of foxes (in thousands) and R the population of rabbits (in thousands). 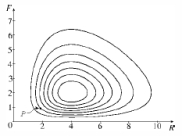 (a) Referring to the graph, what is a reasonable non-zero equilibrium solution for the system?
(b) Write down a possible system of differential equations which could have been used to produce the given graph.(c) Describe how each population changes as time passes, using the initial condition P indicated on the graph.(d) Use your description in part (c) to make a rough sketch of the graph of R and F as functions of time.
Correct Answer:
Verified
(b)
(c) ...
View Answer
Unlock this answer now
Get Access to more Verified Answers free of charge
Q2: Suppose a population growth is modeled
Q3: Suppose a population growth is modeled
Q4: Consider the predator-prey system
Q5: Suppose a population growth is modeled
Q6: Consider the following predator-prey system where
Q8: Suppose that we model populations of
Q9: Suppose a population growth is modeled
Q10: Suppose that we model populations (in
Q11: A predator-prey system is modeled by
Q12: Suppose a population growth is modeled by
Unlock this Answer For Free Now!
View this answer and more for free by performing one of the following actions

Scan the QR code to install the App and get 2 free unlocks

Unlock quizzes for free by uploading documents