In the following figure,  gives the population
  of a certain bacteria culture at time t after a portion of bactericide A was introduced into the population at
  . The graph of g gives the population
  of a similar bacteria culture at time t after a portion of bactericide B was introduced into the population at
  .
. 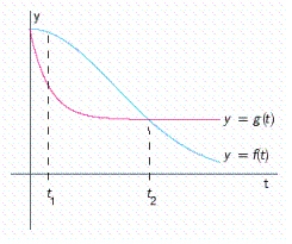 Which population is decreasing faster at
  ?
?
Population __________
Which population is decreasing faster at  ?
?
Population __________
Which bactericide is more effective in reducing the population of bacteria in the short run?
Bactericide __________
Which bactericide is more effective in reducing the population of bacteria in the long run?
Bactericide __________
Correct Answer:
Verified
Q29: Let Q30: Let Q31: Use the four-step process to find the Q32: Use the four-step process to find the Q33: Determine all values of x at which Q35: The position of car A and car Q36: The gross domestic product (GDP) of a Unlock this Answer For Free Now! View this answer and more for free by performing one of the following actions Scan the QR code to install the App and get 2 free unlocks Unlock quizzes for free by uploading documents![]()
![]()

