Essay
The graph shows the volume of wood produced in a single-species forest. Here  is measured in cubic meters/hectare and t is measured in years. By computing the slopes of the respective tangent lines, estimate the rate at which the wood grown is changing at the beginning of year 10 and at the beginning of year 40.
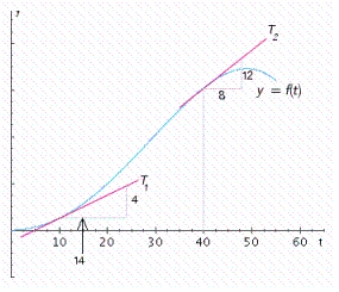
Correct Answer:
Verified
Related Questions
Q34: In the following figure, Q35: The position of car A and car Q36: The gross domestic product (GDP) of a Unlock this Answer For Free Now! View this answer and more for free by performing one of the following actions Scan the QR code to install the App and get 2 free unlocks Unlock quizzes for free by uploading documents![]()

