The table below gives the normal daily mean temperatures, based on a 30-year period 1961 through 1990, for a certain city. Use the data to estimate the amplitude to the nearest degree. 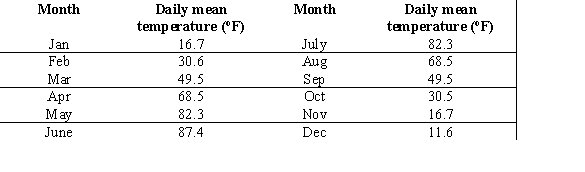
A) 
B) 
C) 
D) 
E) 
Correct Answer:
Verified
Q40: It cost a company $6.75 to produce
Q41: The table below gives the normal daily
Q42: Find the amplitude of the following function.
Q43: What is the amplitude of the following
Q44: Find the period of the following function.
Q45: What is the horizontal shift of the
Q46: Some populations of animals exhibit periodic behavior
Q47: Find the amplitude of the following function.
Q48: The table below gives the normal daily
Q49: Some populations of animals exhibit periodic behavior
Unlock this Answer For Free Now!
View this answer and more for free by performing one of the following actions

Scan the QR code to install the App and get 2 free unlocks

Unlock quizzes for free by uploading documents