A V8 car engine is coupled to a dynamometer and the horsepower y is measured at different engine speeds x (in thousands of revolutions per minute) . The results are shown in the table below. Use a graphing utility to plot the data and graph the cubic model. 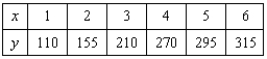
A) 
B) 
C) 
D) 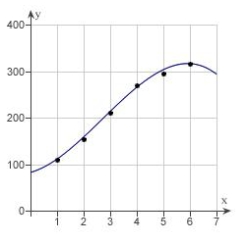
E) 
Correct Answer:
Verified
Q1: Students in a lab measured the breaking
Q2: Students in a lab measured the breaking
Q3: In an experiment, students measured the speed
Q5: Each ordered pair gives the exposure index
Q6: Hooke's Law states that the force F
Q7: Hooke's Law states that the force F
Q8: Students in a lab measured the breaking
Q9: In an experiment, students measured the speed
Q10: A V8 car engine is coupled to
Q11: Hooke's Law states that the force F
Unlock this Answer For Free Now!
View this answer and more for free by performing one of the following actions

Scan the QR code to install the App and get 2 free unlocks

Unlock quizzes for free by uploading documents