In an experiment, students measured the speed s (in meters per second) of a falling object t seconds after it was released. The results are shown in the table below. Use the regression capabilities of a graphing utility to find a linear model for the data. Round all numerical values in your answer to one decimal place. 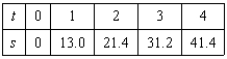
A) 
B) 
C) 
D) 
E) 
Correct Answer:
Verified
Q4: A V8 car engine is coupled to
Q5: Each ordered pair gives the exposure index
Q6: Hooke's Law states that the force F
Q7: Hooke's Law states that the force F
Q8: Students in a lab measured the breaking
Q10: A V8 car engine is coupled to
Q11: Hooke's Law states that the force F
Q12: Which function below would be most appropriate
Q13: Determine which type of function would be
Q14: A V8 car engine is coupled to
Unlock this Answer For Free Now!
View this answer and more for free by performing one of the following actions

Scan the QR code to install the App and get 2 free unlocks

Unlock quizzes for free by uploading documents