Exhibit 16.5.The following data shows the demand for an airline ticket dependent on the price of this ticket. 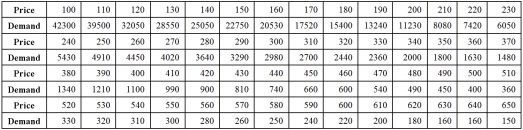 For the assumed cubic and log-log regression models,Demand = β0 + β1Price + β2Price2 + β3Price3 + ε and ln(Demand) = β0 + β1ln(Price) + ε,the following regression results are available:
 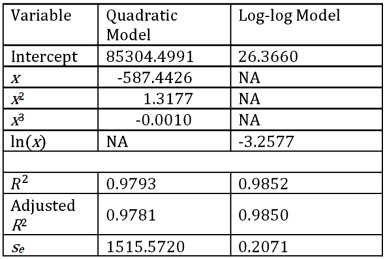 Refer to Exhibit 16.5.What is the percentage of variations in ln(Demand) explained by the log-log regression equation?
A) 98.52%
B) 98.50%
C) 91.39%
D) 97.93%
Correct Answer:
Verified
Q48: What does a positive value for price
Q57: Exhibit 16.2.Typically,the sales volume declines with an
Q58: Exhibit 16-4.The following data shows the cooling
Q59: For the logarithmic model y = β0
Q61: Exhibit 16.6.Thirty employed single individuals were randomly
Q63: Exhibit 16.6.Thirty employed single individuals were randomly
Q64: Exhibit 16.6.Thirty employed single individuals were randomly
Q65: Exhibit 16-4.The following data shows the cooling
Q66: Exhibit 16-4.The following data shows the cooling
Q67: Exhibit 16.5.The following data shows the demand
Unlock this Answer For Free Now!
View this answer and more for free by performing one of the following actions

Scan the QR code to install the App and get 2 free unlocks

Unlock quizzes for free by uploading documents