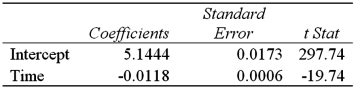
Exhibit 16-4.The following data shows the cooling temperatures of a freshly brewed cup of coffee after it is poured from the brewing pot into a serving cup.The brewing pot temperature is approximately 180º F;see http://mathbits.com/mathbits/tisection/statistics2/exponential.htm 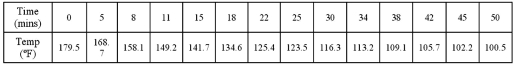 For the assumed exponential model ln(Temp) = β0 + β1Time + ε,the following Excel regression partial output is available.
 Refer to Exhibit 16-4.What is the percentage of variations in ln(Temp) explained by Time?
A) 45.48%
B) 97.01%
C) 1.40%
D) 46.88%
Correct Answer:
Verified
Q48: What does a positive value for price
Q54: Exhibit 16-4.The following data shows the cooling
Q55: The quadratic and logarithmic models,y = β0
Q56: The log-log and exponential models,ln(y)= β0 +
Q57: Exhibit 16.2.Typically,the sales volume declines with an
Q59: For the logarithmic model y = β0
Q61: Exhibit 16.6.Thirty employed single individuals were randomly
Q62: Exhibit 16.5.The following data shows the demand
Q63: Exhibit 16.6.Thirty employed single individuals were randomly
Q75: A model in which both the response
Unlock this Answer For Free Now!
View this answer and more for free by performing one of the following actions

Scan the QR code to install the App and get 2 free unlocks

Unlock quizzes for free by uploading documents