Exhibit 16-1.The following Excel scatterplot with the fitted quadratic regression equation illustrates the observed relationship between productivity and the number of hired workers. 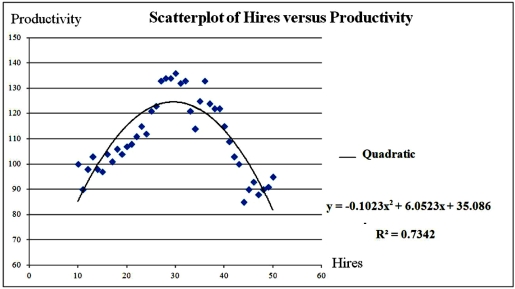 Refer to Exhibit 16.1.Assuming that the values of Hires can be non-integers,what is the maximum value of Productivity?
A) 29.58
B) 124.603
C) 35.086
D) 127.50
Correct Answer:
Verified
Q7: The regression model ln(y)= β0 + β1
Q17: For the model ln(y)= β0 + β1ln(x)+
Q21: Exhibit 16-1.The following Excel scatterplot with the
Q22: What is the effect of b2 <
Q23: Exhibit 16.2.Typically,the sales volume declines with an
Q25: For the quadratic regression equation 
Q26: An inverted U-shaped curve is also known
Q27: Exhibit 16-1.The following Excel scatterplot with the
Q28: Exhibit 16-1.The following Excel scatterplot with the
Q29: For the quadratic regression equation
Unlock this Answer For Free Now!
View this answer and more for free by performing one of the following actions

Scan the QR code to install the App and get 2 free unlocks

Unlock quizzes for free by uploading documents