Exhibit 16-1.The following Excel scatterplot with the fitted quadratic regression equation illustrates the observed relationship between productivity and the number of hired workers. 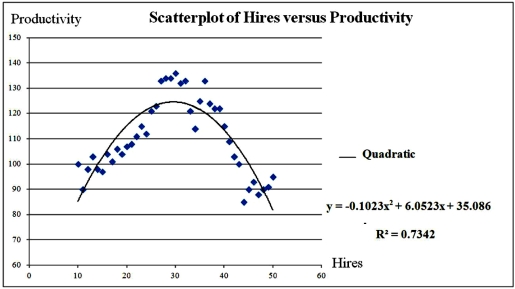 Refer to Exhibit 16.1.What is the percentage of variations in the productivity explained by the number of hired workers?
A) 85.69%
B) 0.7342%
C) 90.54%
D) 73.42%
Correct Answer:
Verified
Q23: Exhibit 16.2.Typically,the sales volume declines with an
Q24: Exhibit 16-1.The following Excel scatterplot with the
Q25: For the quadratic regression equation 
Q26: An inverted U-shaped curve is also known
Q27: Exhibit 16-1.The following Excel scatterplot with the
Q29: For the quadratic regression equation
Q30: Exhibit 16.2.Typically,the sales volume declines with an
Q31: Exhibit 16-1.The following Excel scatterplot with the
Q32: Given the data on y and x,what
Q33: Exhibit 16-1.The following Excel scatterplot with the
Unlock this Answer For Free Now!
View this answer and more for free by performing one of the following actions

Scan the QR code to install the App and get 2 free unlocks

Unlock quizzes for free by uploading documents