The minimum efficient scale in the figure below shows that 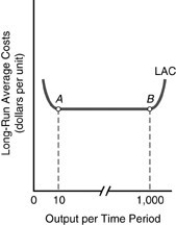
A) point A is the minimum efficient scale (MES) for the firm.
B) point B is the minimum efficient scale (MES) for the firm.
C) the long-run average cost curve (LAC) reaches a minimum point at B.
D) the minimum efficient scale (MES) illustrates maximum average costs.
Correct Answer:
Verified
Q381: Explain how the long-run average cost curve
Q382: Why might firms experience diseconomies of scale?
Q383: "A firm cannot experience both economies of
Q384: How is the long-run average cost curve
Q385: "The short-run average total cost curve and
Q386: "The long-run average cost curve is derived
Q387: What factors generate economies of scale?
Q388: For an industry in which average costs
Q389: What is minimum efficient scale? Why is
Q390: "If an industry's minimum efficient scale is
Unlock this Answer For Free Now!
View this answer and more for free by performing one of the following actions

Scan the QR code to install the App and get 2 free unlocks

Unlock quizzes for free by uploading documents