Figure 10.2 shows the U.S. housing price index (solid line, left axis) and one year adjustable mortgage rates-a proxy for subprime loans (dashed line, right axis). In the context of the housing and financial crisis, discuss the relationship between these two series.
Figure 10.2: Housing prices and one-year adjustable mortgage rates 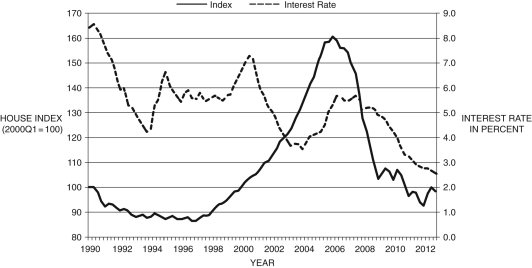
(Source: Federal Reserve Economic Data, St. Louis Federal Reserve)
Correct Answer:
Verified
View Answer
Unlock this answer now
Get Access to more Verified Answers free of charge
Q86: In 2009, China and India both experienced
Q91: In the trough of the Great Recession,
Q94: By August of 2007, almost 16 percent
Q96: Loans, investments, and cash are on the
Q98: According to The Economist, in 2006, approximately
Q100: Subprime loans are loans made to households
Q101: Figure 10.3: Q101: When depositors rush to get their deposits Q102: Figure 10.3: Q103: How does "securitization" reduce overall risk?![]()
![]()
Unlock this Answer For Free Now!
View this answer and more for free by performing one of the following actions

Scan the QR code to install the App and get 2 free unlocks

Unlock quizzes for free by uploading documents