Sketch a scatter plot of the data shown in the table. The table shows the number y of Wal-Mart stores for each year x from 2000 through 2007.
A) ? 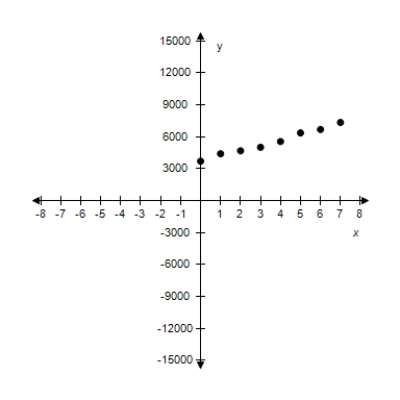 x: Year (0 ? 2000)
Y: Number of stores
B) ? 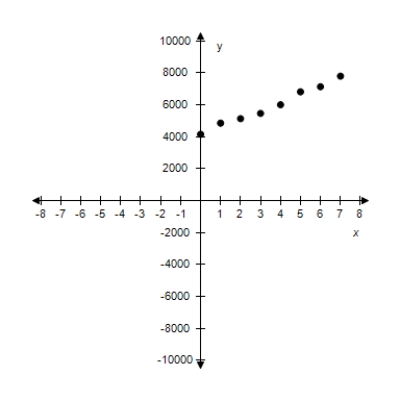 x: Year (0 ? 2000)
Y: Number of stores
C) ? 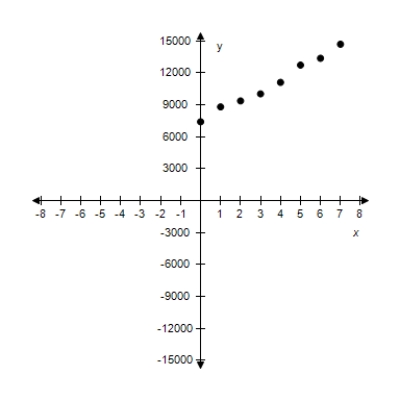 ?
?
X: Year (0 ? 2000)
Y: Number of stores
D) ? 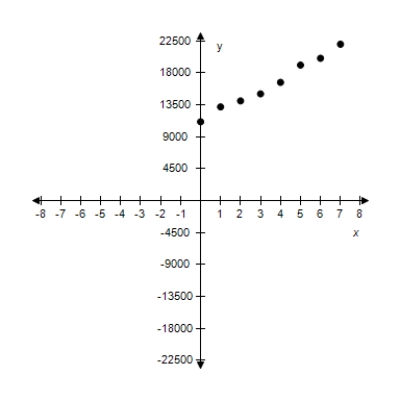 x: Year (0 ? 2000)
Y: Number of stores
E) ? 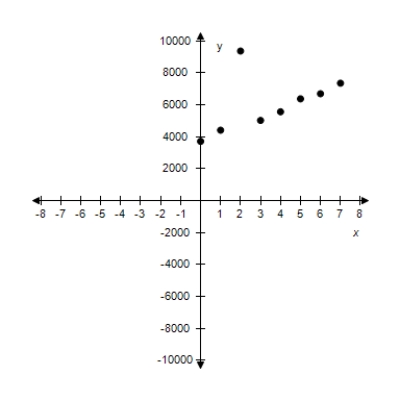 x: Year (0 ? 2000)
Y: Number of stores
Correct Answer:
Verified
Q2: A point is located five units below
Q3: Determine the quadrant(s)in which (x,y)is located so
Q4: Determine the quadrant(s)in which (x,y)is located so
Q5: A point is located six units to
Q6: Determine the quadrant(s)in which (x,y)is located so
Q7: Determine the quadrant(s)in which (x,y)is located so
Q8: Plot the points below whose coordinates are
Q9: Plot the points in the Cartesian plane.
Q10: Determine the quadrant(s)in which (x,y)is located so
Q11: Determine the quadrant(s)in which (x,y)is located so
Unlock this Answer For Free Now!
View this answer and more for free by performing one of the following actions

Scan the QR code to install the App and get 2 free unlocks

Unlock quizzes for free by uploading documents