The table shows the average daily high temperatures in Houston H (in degrees Fahrenheit) for month t,with t = 1 corresponding to January.
Select the correct scatter plot from the above data.
A) 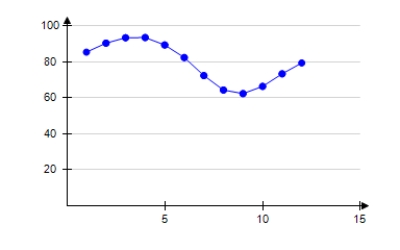
B) 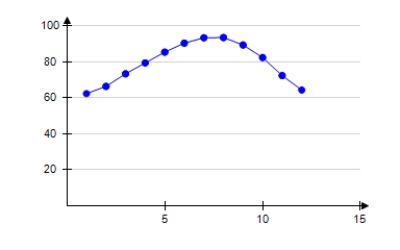
C) 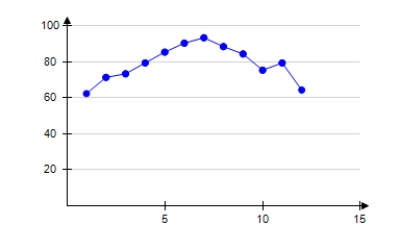
D) 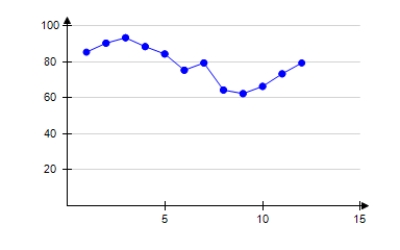
E) 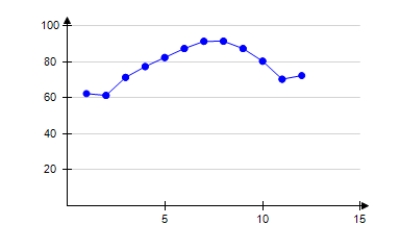
Correct Answer:
Verified
Q25: Solve the multiple-angle equation.
Q26: Use a graphing utility to graph
Q27: Solve the multiple-angle equation.
Q28: Use inverse functions where needed to
Q29: A weight is oscillating on the
Q31: Solve the following equation.
Q32: Solve the following equation.
Q33: Use a graphing utility to graph
Q34: Use a graphing utility to graph
Q35: Solve the multiple-angle equation.
Unlock this Answer For Free Now!
View this answer and more for free by performing one of the following actions

Scan the QR code to install the App and get 2 free unlocks

Unlock quizzes for free by uploading documents