Plot the following points: (6, 2) , (7, 5) , (8, 8) , (9, 9) . In your scatter diagram, sketch a line that best seems to fit the data. Estimate the slope and the y-intercept of the line.
A) Estimated slope: 2; Estimated y-intercept: -12.5 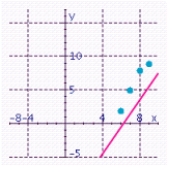
B) Estimated slope: 2.5; Estimated y-intercept: -13 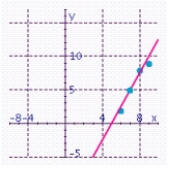
C) Estimated slope: 2.9; Estimated y-intercept: -15.3 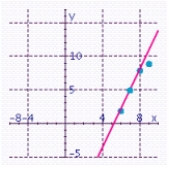
D) Estimated slope: 1.2; Estimated y-intercept: -1.5 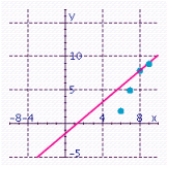
E) Estimated slope: 2.5; Estimated y-intercept: -16 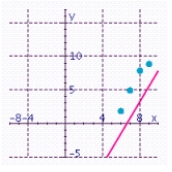
Correct Answer:
Verified
Q2: Suppose that the revenue generated by
Q3: Sketch the graph of the function
Q4: Graph the quadratic function. Specify the
Q5: Sketch the graph of the function and
Q6: A triangle is inscribed in a
Q8: Sketch the graph of the function and
Q9: What is the largest possible area for
Q10: Find the linear function satisfying the
Q11: For the following figure, express the
Q12: Find all fixed points of the
Unlock this Answer For Free Now!
View this answer and more for free by performing one of the following actions

Scan the QR code to install the App and get 2 free unlocks

Unlock quizzes for free by uploading documents