The following stem-and-leaf display shows the number of homeless cats and dogs that had to be euthanized each year in a large city for the period 1985-2004.Use both the stemplot and timeplot to describe the distribution. Euthanized Animal Totals 90
89
88
87
86
85
84
83
82
81 \ Key:
cats and dogs euthanized 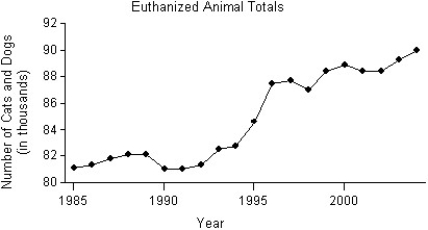
A) The distribution of the number of cats and dogs that were euthanized is skewed to the right,and has several modes,with gaps in between.One mode is clustered between 87,000 and 90,000 euthanized,a second mode at 84,000,and a third mode with a cluster between 81,000 and 82,000.The timeplot shows that the number of animals euthanized has increased over the period 1985-2004,with a significant increase between 1994 and 1996.
B) The distribution of the number of cats and dogs that were euthanized is bimodal.The upper cluster is between 87,000 and 90,000 euthanized,with a centre at around 88,400.The lower cluster is between 81,000 and 82,000 euthanized,with a centre at around 81,000.The timeplot shows that the number of animals euthanized has decreased over the period 1985-2004,with a significant decrease between 1994 and 1996.
C) The distribution of the number of cats and dogs that were euthanized is bimodal.The upper cluster is between 87,000 and 90,000 euthanized,with a centre at around 88,400.The lower cluster is between 81,000 and 82,000 euthanized,with a centre at around 81,000.The timeplot shows that the number of animals euthanized has increased over the period 1985-2004,with a significant increase between 1994 and 1996.
D) The distribution of the number of cats and dogs that were euthanized is bimodal.The upper cluster is between 89,000 and 90,000 euthanized,with a centre at around 88,400.The lower cluster is between 81,000 and 82,000 euthanized,with a centre at around 81,000.The timeplot shows that the number of animals euthanized has increased over the period 1985-2004,with a significant increase between 1994 and 1996.
E) The distribution of the number of cats and dogs that were euthanized is skewed to the left,and has several modes,with gaps in between.One mode is clustered between 87,000 and 90,000 euthanized,a second mode at 84,000,and a third mode with a cluster between 81,000 and 82,000.The timeplot shows that the number of animals euthanized has increased over the period 1985-2004,with a significant increase between 1994 and 1996.
Correct Answer:
Verified
Q17: The back-to-back stem-and-leaf display compares the
Q18: Here are 3 boxplots of weekly gas
Q19: Which class had the smallest IQR?
A)Class 1,because
Q20: Which class had the highest mean score?
A)Class
Q21: Here are the summary statistics for
Q23: The times,in minutes,it took for 21 students
Q24: The boxplots display case prices (in dollars)of
Q25: The reaction time of 20 drivers
Q26: The weekly salaries (in dollars)of 24 randomly
Q27: Use the high closing values of
Unlock this Answer For Free Now!
View this answer and more for free by performing one of the following actions

Scan the QR code to install the App and get 2 free unlocks

Unlock quizzes for free by uploading documents