Here are the summary statistics for mathematics scores for one high school graduating class,and the parallel boxplots comparing the scores of male and female students.Write a brief report on these results.Be sure to discuss shape,centre,and spread of the scores. 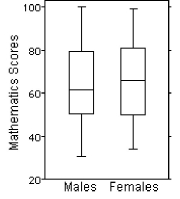
A) Median score by females at 66 points is 3 points higher than that by males,and female mean is higher by 5.The middle 50% for both group is close with a IQR at 26 for the males and 30 for the females.The males have a larger range from 30 to 100.The distribution is right-skewed for the females and symmetric for the males.
B) Median score by females at 66 points is 3 points higher than that by males,and female mean is higher by 5.The middle 50% for both group is close with a IQR at 26 for the males and 30 for the females.The males have a larger range from 30 to 100.Both distributions are right-skewed.
C) Median score by females at 66 points is 3 points higher than that by males,and female mean is higher by 5.The middle 50% for both group is close with a IQR at 26 for the males and 30 for the females.The males have a larger range from 30 to 100.The distribution is right-skewed for the males and symmetric for the females.
D) Median score by females at 66 points is 3 points higher than that by males,and male mean is higher by 5.The middle 50% for both group is close with a IQR at 30 for the males and 26 for the females.The males have a larger range from 30 to 100.The distribution is right-skewed for the males and symmetric for the females.
E) Median score by females at 66 points is 3 points higher than that by males,and female mean is higher by 5.The middle 50% for both group is close with a IQR at 26 for the males and 30 for the females.The males have a smaller range from 30 to 100.Both distributions are left-skewed.
Correct Answer:
Verified
Q16: Which class had the smallest standard deviation?
A)Class
Q17: The back-to-back stem-and-leaf display compares the
Q18: Here are 3 boxplots of weekly gas
Q19: Which class had the smallest IQR?
A)Class 1,because
Q20: Which class had the highest mean score?
A)Class
Q22: The following stem-and-leaf display shows the
Q23: The times,in minutes,it took for 21 students
Q24: The boxplots display case prices (in dollars)of
Q25: The reaction time of 20 drivers
Q26: The weekly salaries (in dollars)of 24 randomly
Unlock this Answer For Free Now!
View this answer and more for free by performing one of the following actions

Scan the QR code to install the App and get 2 free unlocks

Unlock quizzes for free by uploading documents