Refer to the figure showing the steps used in microarray analysis to detect differences in expression between tumor tissue and normal tissue.The spots in the bottom panel represent individual genes for patients who have good prognoses (left) as well as for patients who have poor ones (right).The colors of those spots represent levels of expression: red = high expression, yellow = intermediate expression, green = low expression. 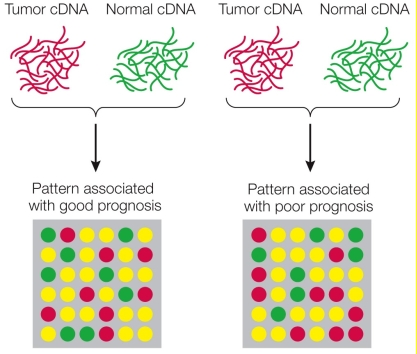 Look at the top leftmost spot.At this gene, patients with poor prognoses have _______ expression than patients with good prognoses.
Correct Answer:
Verified
Q217: People who rely on rice as
Q218: A human gene is inserted into a
Q219: Refer to the table.A gene might affect
Q220: The AluI restriction enzyme makes a single
Q221: cDNA libraries
A) are the same as genomic
Q223: Which DNA sequence forms a palindromic restriction
Q224: Variation at a specific gene is known
Q225: The RNA in RNAi (RNA interference) is
A)
Q226: A vector designed for the expression of
Q227: Refer to the table showing results from
Unlock this Answer For Free Now!
View this answer and more for free by performing one of the following actions

Scan the QR code to install the App and get 2 free unlocks

Unlock quizzes for free by uploading documents