Figure 13-2 shows shifts in the aggregate demand curve. Which of the following combinations would be illustrated by a shift in aggregate demand from AD0 to AD1?Figure 13-2 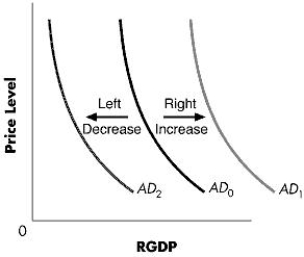
A) A slow increase in government purchases combined with a large decrease in investment
B) An increase in consumption combined with an increase in exports
C) An increase in business tax rates combined with a decrease in consumer confidence
D) An increase in the growth rates of a major trading partner combined with a severe slowdown in stock market wealth
E) An increase in exports combined with an even larger increase in imports
Correct Answer:
Verified
Q38: The figure below shows the relationship between
Q39: Jason has been holding his retirement savings
Q40: Which of the following will cause consumption
Q41: The short-run aggregate supply curve:
A)has the same
Q42: Which of the following would be true
Q44: The short-run aggregate supply curve:
A)represents a fixed
Q45: Along the long-run aggregate supply curve, the
Q46: Which of the following would be true
Q47: Figure 13-3 shows the relationship between real
Q48: The short-run aggregate supply curve is:
A)typically vertical.
B)typically
Unlock this Answer For Free Now!
View this answer and more for free by performing one of the following actions

Scan the QR code to install the App and get 2 free unlocks

Unlock quizzes for free by uploading documents