The figure below shows the relationship between the real GDP and the price level of an economy. In the figure, _____ represents aggregate demand.Figure 13-1 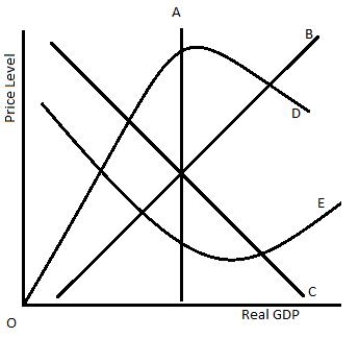
A) curve A
B) curve B
C) curve C
D) curve D
E) curve E
Correct Answer:
Verified
Q33: Which of the following is likely to
Q34: Investment will increase if:
A)business taxes and real
Q35: Sam prefers holding his savings as cash
Q36: An increase in the U.S. price level
Q37: Which of the following will decrease aggregate
Q39: Jason has been holding his retirement savings
Q40: Which of the following will cause consumption
Q41: The short-run aggregate supply curve:
A)has the same
Q42: Which of the following would be true
Q43: Figure 13-2 shows shifts in the aggregate
Unlock this Answer For Free Now!
View this answer and more for free by performing one of the following actions

Scan the QR code to install the App and get 2 free unlocks

Unlock quizzes for free by uploading documents