Figure 8-1 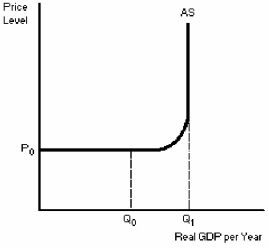
-According to Figure 8-1,a decrease in aggregate demand between real GDP levels Q₁ and Q₀
A) would most likely result in some inflation.
B) would not increase output since the economy is already working at full capacity.
C) would have no effect on the price level.
D) would cause price levels to fall.
Correct Answer:
Verified
Q8: Figure 8-1 Q15: If the price level kept decreasing,the short-run Q17: The short-run aggregate supply curve represents the Q18: In the short run,an increase in the Q19: In the _,an increase in the price Q21: As the _ increases,the short-run aggregate supply Q22: As the price level increases,the short-run aggregate Q23: With respect to slope,the short-run aggregate supply Q24: We distinguish between the long-run aggregate supply Q25: The positive relationship between the short-run aggregate![]()
Unlock this Answer For Free Now!
View this answer and more for free by performing one of the following actions

Scan the QR code to install the App and get 2 free unlocks

Unlock quizzes for free by uploading documents