Multiple Choice
Figure 8-1 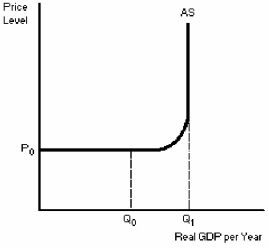
-According to Figure 8-1,________ in aggregate demand between real GDP levels Q₀ and Q₁ would most likely result in some inflation.
A) an increase
B) a decrease
C) a lateral movement
D) movement
Correct Answer:
Verified
Related Questions
Q3: The short-run aggregate supply curve represents the
Q4: If the price level kept increasing,the short-run
Q5: If the price level kept increasing,the _
Unlock this Answer For Free Now!
View this answer and more for free by performing one of the following actions

Scan the QR code to install the App and get 2 free unlocks

Unlock quizzes for free by uploading documents