Multiple Choice
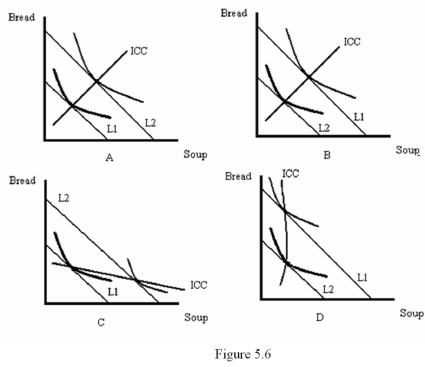
-Refer to Figure 5.6.Which diagram shows an increase in income with bread being inferior and soup being normal?
A) A
B) B
C) C
D) D
Correct Answer:
Verified
Related Questions
Q49: If an increase in the price of
Q50: If two goods are substitutes,then an increase
Q51: Q52: A curve that describes the relationship between Q53: In Canada provincial regulatory boards set tiered Q55: Suppose that books are measured on the Q55: Which of the following statements is true? Q56: When a good is normal, Q57: If a change in the price of Q59: ![]()
A)
A) An increase![]()
Unlock this Answer For Free Now!
View this answer and more for free by performing one of the following actions

Scan the QR code to install the App and get 2 free unlocks

Unlock quizzes for free by uploading documents