Multiple Choice
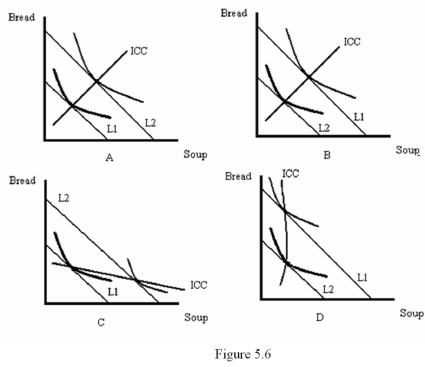
-Refer to Figure 5.6.Which diagram shows an increase in income with both bread and soup being normal goods?
A) A
B) B
C) C
D) D
Correct Answer:
Verified
Related Questions
Q46: Q47: Q48: If the income-consumption path slopes upward,then Q49: If an increase in the price of Q50: If two goods are substitutes,then an increase Q52: A curve that describes the relationship between Q53: In Canada provincial regulatory boards set tiered Unlock this Answer For Free Now! View this answer and more for free by performing one of the following actions Scan the QR code to install the App and get 2 free unlocks Unlock quizzes for free by uploading documents![]()
![]()
A) Both

