Table 20-8
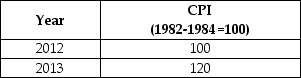
-Refer to Table 20-8. Suppose that the data in the table above reflect the price levels in the economy. What is the inflation rate in between 2012 and 2013?
A) 2%
B) 5%
C) 10%
D) 12%
E) 20%
Correct Answer:
Verified
Q145: A consumer price index of 160 in
Q163: Table 20-7 Q163: The CPI is also referred to as Q165: Table 20-5 Q165: The producer price index measures the prices Q167: The consumer price index implicitly assumes that Q170: Your grandfather tells you that he earned Q171: The most widely used measure of inflation Q171: Which of the following would be a Q172: The Bureau of Labor Statistics has taken
![]()
A)the
![]()
Unlock this Answer For Free Now!
View this answer and more for free by performing one of the following actions

Scan the QR code to install the App and get 2 free unlocks

Unlock quizzes for free by uploading documents