Multiple Choice
Table 20-7
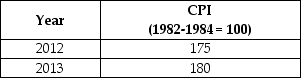
-Refer to Table 20-7. Suppose that the data in the table above reflect price levels in the economy. What is the inflation rate between 2012 and 2013?
A) 2.9%
B) 3.5%
C) 4.6%
D) 5%
E) 7.5%
Correct Answer:
Verified
Related Questions
Q140: The unemployment rate tends to be higher
Q145: A consumer price index of 160 in
Q150: What are some reasons why the unemployment
Q158: If the price level rose in three
Unlock this Answer For Free Now!
View this answer and more for free by performing one of the following actions

Scan the QR code to install the App and get 2 free unlocks

Unlock quizzes for free by uploading documents