The figure given below shows the cost curves of a firm.Figure 9.3
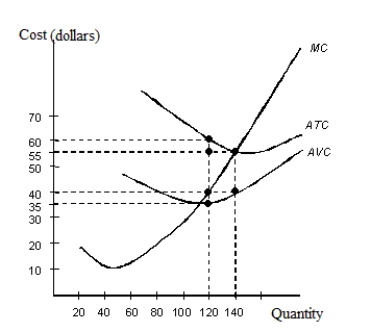 ATC: Average Total Cost
AVC: Average Variable Cost
MC: Marginal Cost
-In Figure 9.3, what is the total cost of producing 140 units of the output?
A) $40
B) $55
C) $300
D) $5,600
E) $7,700
Correct Answer:
Verified
Q23: The table given below reports the marginal
Q24: The table given below reports the marginal
Q25: The table given below reports the marginal
Q26: The following graph shows the demand and
Q27: The table given below reports the marginal
Q29: The table given below reports the marginal
Q30: The following graph shows the demand and
Q31: The following graph shows the marginal revenue
Q32: The table given below reports the marginal
Q33: The table given below reports the marginal
Unlock this Answer For Free Now!
View this answer and more for free by performing one of the following actions

Scan the QR code to install the App and get 2 free unlocks

Unlock quizzes for free by uploading documents