The following graph shows the marginal revenue (MR) and marginal cost (MC) curves of an imperfectly competitive firm.Figure 9.2
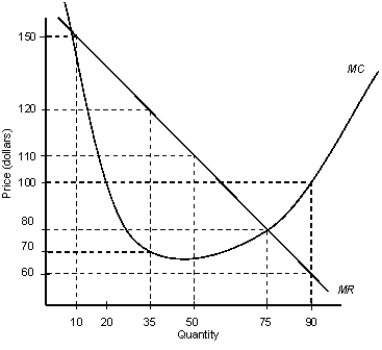
-Refer to Figure 9.2. If the current production level is 90 and the firm wishes to maximize profit, it should:
A) continue to produce at the current level.
B) decrease the quantity produced to 75.
C) decrease the quantity produced to 50.
D) decrease the quantity produced to 35.
E) increase production until MR = MC.
Correct Answer:
Verified
Q26: The following graph shows the demand and
Q27: The table given below reports the marginal
Q28: The figure given below shows the cost
Q29: The table given below reports the marginal
Q30: The following graph shows the demand and
Q32: The table given below reports the marginal
Q33: The table given below reports the marginal
Q34: The following graph shows the marginal revenue
Q35: The table given below reports the marginal
Q36: The following graph shows the marginal revenue
Unlock this Answer For Free Now!
View this answer and more for free by performing one of the following actions

Scan the QR code to install the App and get 2 free unlocks

Unlock quizzes for free by uploading documents