The table given below reports the quantity demanded and supplied of a commodity in a market at different price levels.Table 3.4
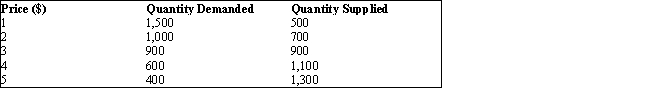
-Refer to Table 3.4. In the market represented by this table, at equilibrium:
A) the market price is $5 per unit.
B) there is a surplus of 900 units.
C) there is a shortage of 900 units.
D) 900 units are traded at a price of $3 per unit.
E) the market price is $1 per unit and the quantity traded is 500 units.
Correct Answer:
Verified
Q37: The table given below reports the quantity
Q38: The table given below reports the quantity
Q39: The table given below reports the quantity
Q40: The table given below reports the quantity
Q41: The figure given below shows the demand
Q43: The figure given below shows the demand
Q44: The figure given below shows the demand
Q45: The table given below reports the quantity
Q46: The table given below reports the quantity
Q47: The table given below reports the quantity
Unlock this Answer For Free Now!
View this answer and more for free by performing one of the following actions

Scan the QR code to install the App and get 2 free unlocks

Unlock quizzes for free by uploading documents