The figure below shows the short-run aggregate supply of an economy.Which of the following is likely to be true if the actual price level in this figure exceeds the expected price level?
Figure 10.1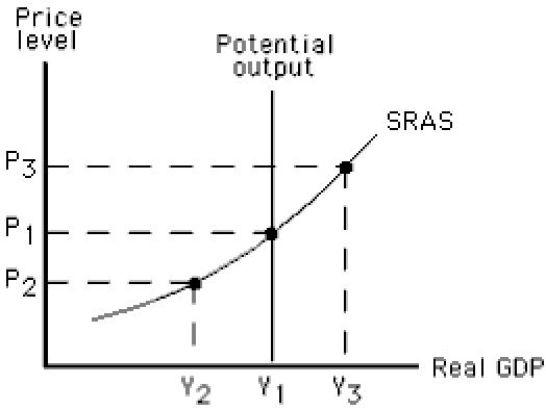
A) Equilibrium output will be Y2 in the short run.
B) Equilibrium output will be Y1 in the short run.
C) The actual unemployment rate is below the natural rate.
D) Potential output is greater than actual output.
E) The actual price level is less than the equilibrium price level.
Correct Answer:
Verified
Q22: Which of these is not assumed to
Q39: Which of the following is true if
Q44: Suppose the actual and expected price levels
Q50: Suppose the actual and expected price levels
Q53: When actual output increases the potential output,_.
A)more
Q60: In the short run,there is a positive
Q70: Which of the following explains the shape
Q75: Consider schedule #1 in the aggregate demand
Q76: The figure below shows the short-run aggregate
Q79: The figure below shows the short-run aggregate
Unlock this Answer For Free Now!
View this answer and more for free by performing one of the following actions

Scan the QR code to install the App and get 2 free unlocks

Unlock quizzes for free by uploading documents