The figure below shows the short-run aggregate supply curve of an economy.If the actual price level exceeds the expected price level,then:
Figure 10.1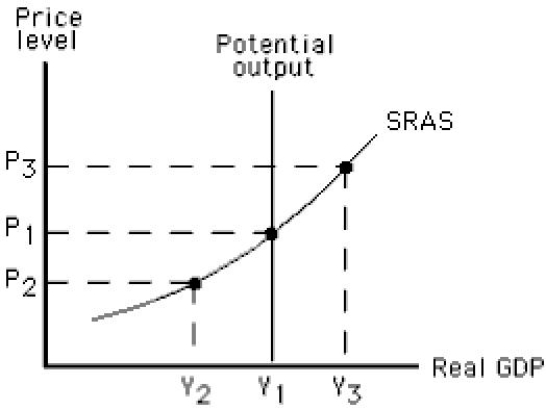
A) equilibrium output is likely to be Y2 in the short run.
B) equilibrium output is likely to be Y1 in the short run.
C) equilibrium output is likely to be Y3 in the short run.
D) potential output is greater than actual output.
E) unemployment is above the natural rate.
Correct Answer:
Verified
Q39: Which of the following is true if
Q48: An expansionary gap in the short-run results
Q60: In the short run,there is a positive
Q64: Which of the following occurs when an
Q74: The figure below shows the short-run aggregate
Q75: Consider schedule #1 in the aggregate demand
Q76: The figure below shows the short-run aggregate
Q82: The figure below shows equilibrium in an
Q83: The figure below shows the short-run aggregate
Q84: The figure below shows equilibrium in an
Unlock this Answer For Free Now!
View this answer and more for free by performing one of the following actions

Scan the QR code to install the App and get 2 free unlocks

Unlock quizzes for free by uploading documents